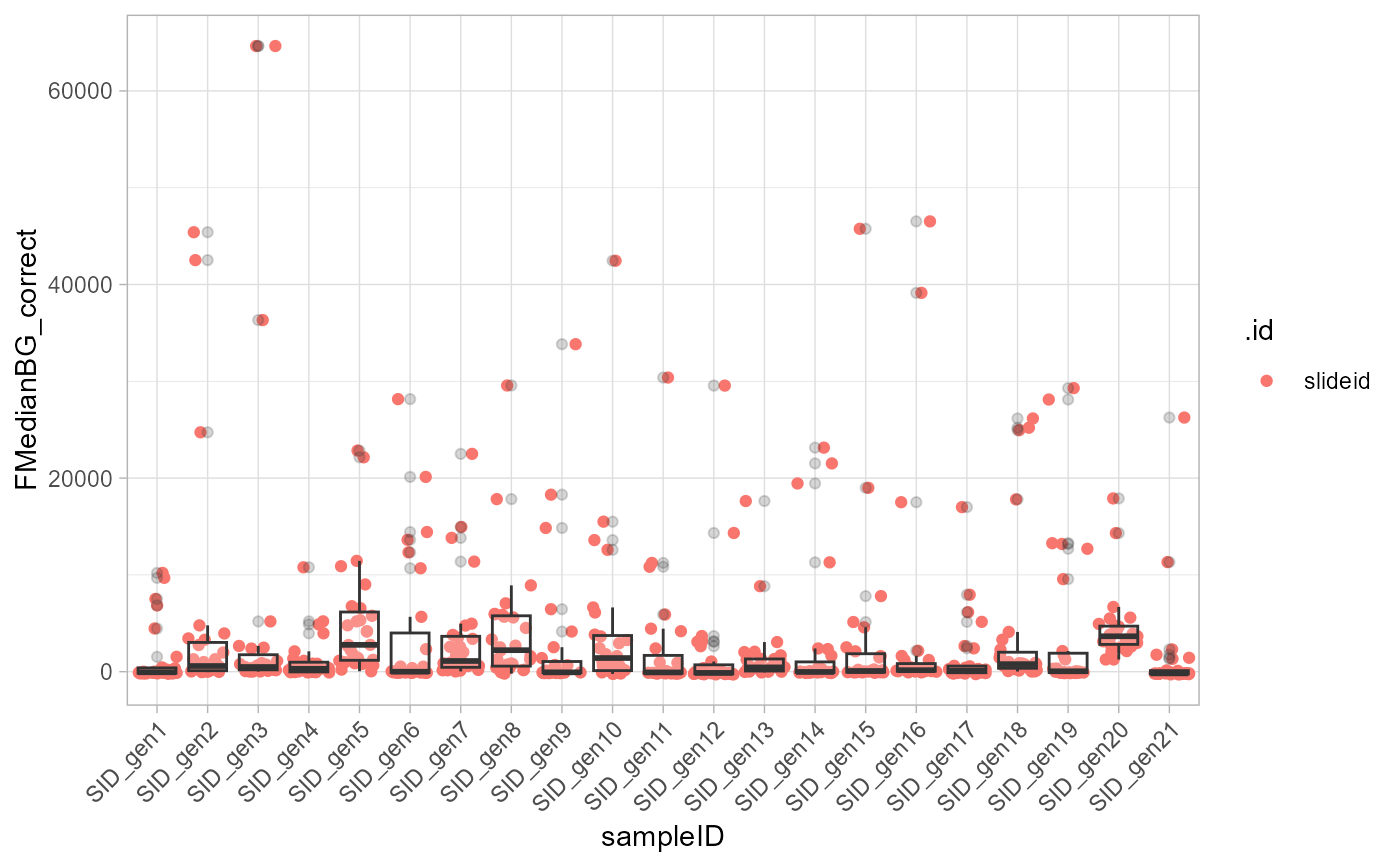
Plot the buffer values
plot_buffer(
  df = buffers,
  buffer_names = "antigen",
  buffer_mfi = "FMedianBG_correct",
  slide_id = ".id"
)
Arguments
- df
A data frame to be used to plot
- buffer_names
A character string containing the name of the variable with buffer spots. Default set to 'antigen'.
- buffer_mfi
A character string containing the name of the variable with MFI value.Assuming background correction is done already. Default to 'FMedianBG_correct'
- slide_id
A character string containing the name of the slide/array identifier variable.
Value
plot of buffer spots
Examples
buffers <- readr::read_csv(system.file("extdata", "buffers_sample2.csv",
package="protGear"))
#> Rows: 567 Columns: 7
#> ── Column specification ────────────────────────────────────────────────────────
#> Delimiter: ","
#> chr (3): sampleID, antigen, .id
#> dbl (4): FMedianBG_correct, Block, Column, Row
#>
#> ℹ Use `spec()` to retrieve the full column specification for this data.
#> ℹ Specify the column types or set `show_col_types = FALSE` to quiet this message.
plot_buffer(df=buffers,buffer_names = "sampleID")