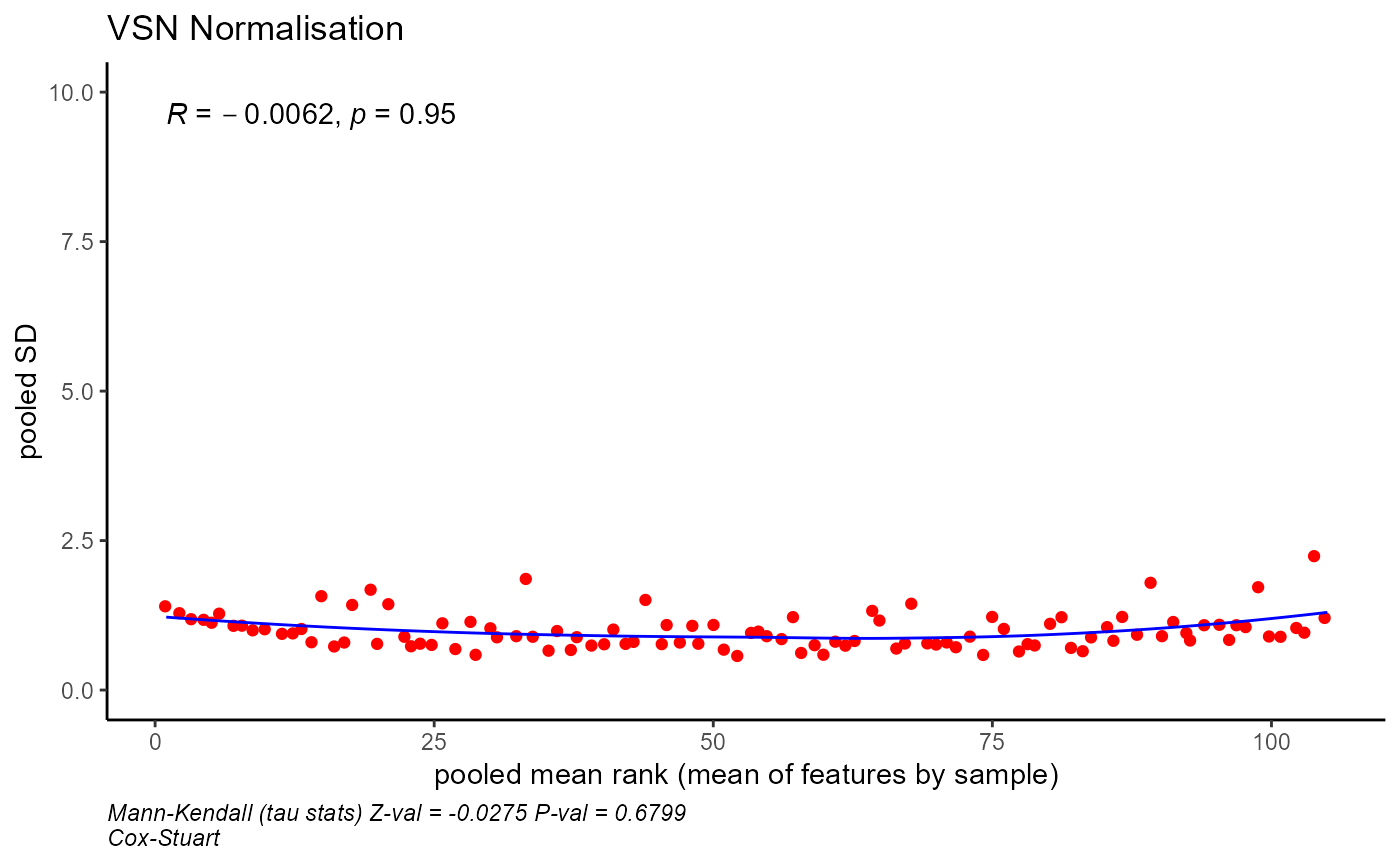
Comparison of normalised data by sample
plot_normalised(exprs_normalised_df, method, batch_correct)Arguments
- exprs_normalised_df
a normalised data frame
- method
the method of normalisation used
- batch_correct
the batch correction
Value
A ggplot of normalised data
Examples
matrix_antigen <- readr::read_csv(system.file("extdata",
"matrix_antigen.csv", package="protGear"))
#> Rows: 105 Columns: 117
#> ── Column specification ────────────────────────────────────────────────────────
#> Delimiter: ","
#> dbl (117): AARP, AMA1, ASP, Buffer, CD4TAG, CLAG3.2, CommercialHumanIgG, EBA...
#>
#> ℹ Use `spec()` to retrieve the full column specification for this data.
#> ℹ Specify the column types or set `show_col_types = FALSE` to quiet this message.
normlise_vsn <- matrix_normalise(as.matrix(matrix_antigen),
method = "vsn",
return_plot = FALSE
)
plot_normalised(normlise_vsn,method="vsn",batch_correct=FALSE)
#> `geom_smooth()` using method = 'loess' and formula = 'y ~ x'
