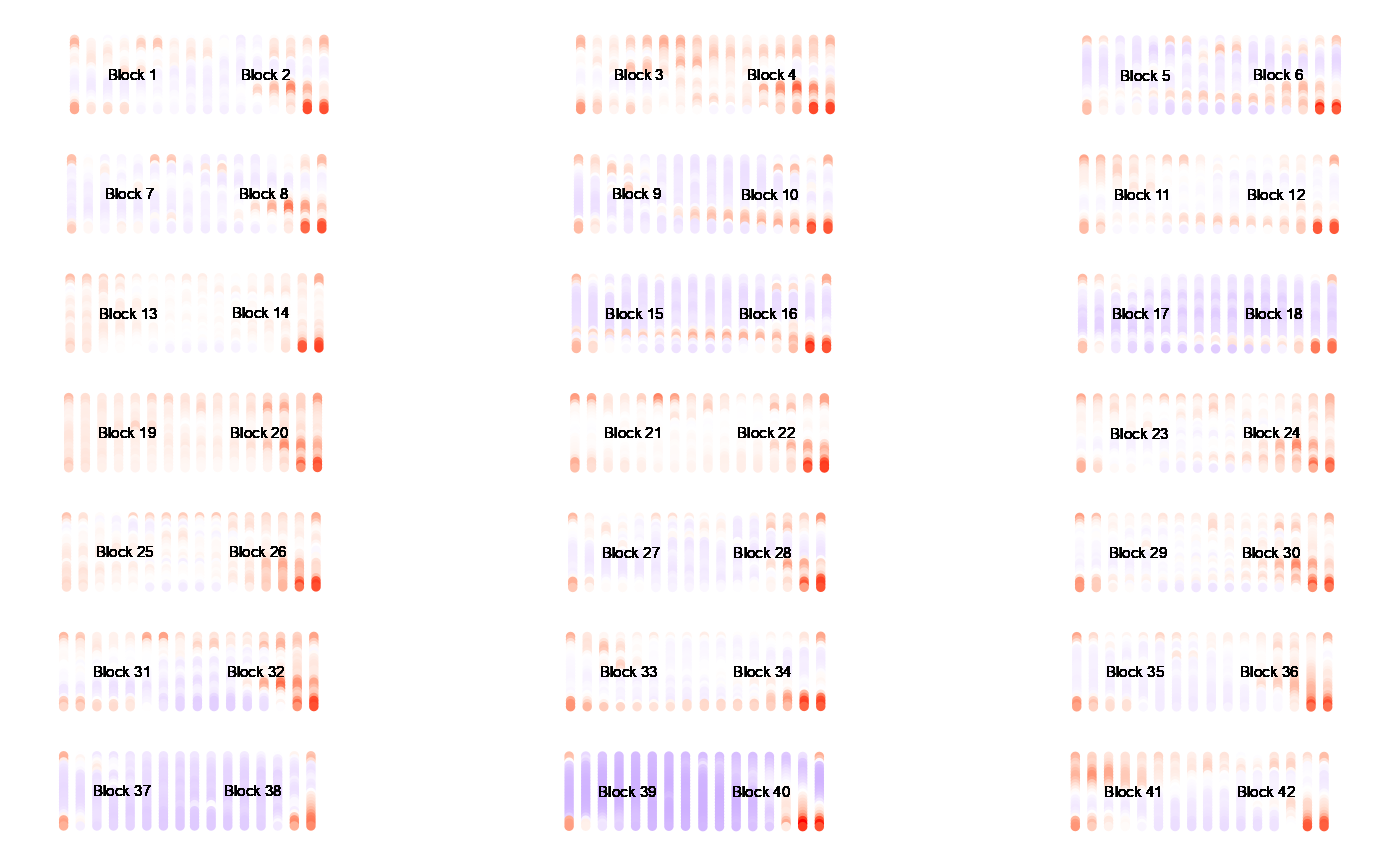
Visualize the slide mimicking the original scan image.
Source:R/read_files_functions.R
visualize_slide.RdVisualize the slide mimicking the original scan image.
visualize_slide(infile, MFI_var, interactive = FALSE, d_f = NA)Arguments
- infile
a .gpr file to be used to visualize the expression intensities of the slide spots
- MFI_var
the MFI variable to plot, can be either the background or foreground value
- interactive
a logical to specify whether an interactive graph is returned or not
- d_f
a data frame with array data
Value
A ggplot of slide foreground values
Examples
## Not run:
visualize_slide(
infile = system.file("extdata", "/array_data/machine1/KK2-06.txt",
 package="protGear"),
MFI_var = "B635 Median"
)

## End(Not run)